Home « Mediation, Employment, Civil Rights « Sexual-Orientation Discrimination
Winners and Losers: Employment Discrimination
Trials in the Southern and Eastern
Districts of New York: 2016 Update
NYSBA Labor and Employment Law Journal
April 14, 2017
 n 2012, the author published an article entitled Winners
and Losers: Employment Discrimination Trials in the
Southern and Eastern Districts of New York.1 The genesis
of the study was scholars’ and practitioners’ widespread
perception that employment discrimination plaintiffs
have a diffi cult row to hoe. They fare poorly, both as
compared with plaintiffs in other types of action and absolutely—losing
much more often than winning. This is
true at all stages of litigation: pre-trial, trial and appeal.2 n 2012, the author published an article entitled Winners
and Losers: Employment Discrimination Trials in the
Southern and Eastern Districts of New York.1 The genesis
of the study was scholars’ and practitioners’ widespread
perception that employment discrimination plaintiffs
have a diffi cult row to hoe. They fare poorly, both as
compared with plaintiffs in other types of action and absolutely—losing
much more often than winning. This is
true at all stages of litigation: pre-trial, trial and appeal.2
Some writers have speculated about the causes of
this phenomenon. Reasons cited have ranged from biased
decision makers and overly defendant-friendly doctrine3
to multiple practical considerations lending an advantage
to the employer.4 Parties, advocates and neutrals,
however, are usually less concerned with the “why” than
the “who” and “how much:” who prevails and to what
extent? The better the players can quantify the riskadjusted
value of a case (or, from the opposite viewpoint,
the defendant’s exposure), the better they can decide the
terms on which they should settle. Moreover, the sooner
they can do so, the more they can save in transaction
costs—above all attorneys’ fees.
”On reconsideration, the numbers did not
strike the author as very useful.”
With data compiled from two years’ worth of entries
on the PACER system (2004 and 2005), the piece made
a number of tentative conclusions about the success of
plaintiffs in establishing liability and recovering emotional
distress and, occasionally, punitive damages.
Results were given for the districts combined as well as
by individual district and were further broken down by
public versus private defendant. In addition, the writer
computed average and median times from fi ling to verdict.
Our primary fi nding was that plaintiffs prevailed in
slightly under one-third of the cases, a result that drew
general support from a variety of other sources discussed
in the article.5
As we will see, the updating numbers confi rm this
conclusion. Moreover, instead of a total of just 57 trials
over two years, we now have 160 trials culled from a seven-year
data base. This increase gives us more confi dence
in our numbers. We hope, therefore, that our targeted
audience, mainly attorneys and neutrals in the employment
area, will feel comfortable relying on our present
fi ndings for general guidance in assessing the likely risks
and rewards of trial versus settlement.6
The Revised Study: Methodology
Using PACER’s online service, as before, the author
retrieved all lawsuits under the titles 442 (“Civil Rights:
Jobs”) and 445 (“Americans With Disabilities—Employment”),
fi led from the start of January, 2004 through the
aend of December, 2010—an expansion of seven years of
the data originally mined. We tabulated all cases culminating
in jury verdicts or judicial fi ndings after bench
trials (the latter were few and far between). Our inquiry
yield ed 160: 70 in the SDNY and 90 in the EDNY.7 We
also determined the number of plaintiffs represented
by the cases. Because of some multi-plaintiff trials, the
fi gures were larger: 106 in the Southern District and 94 in
the Eastern District, making for a combined total of 200
plaintiffs.8
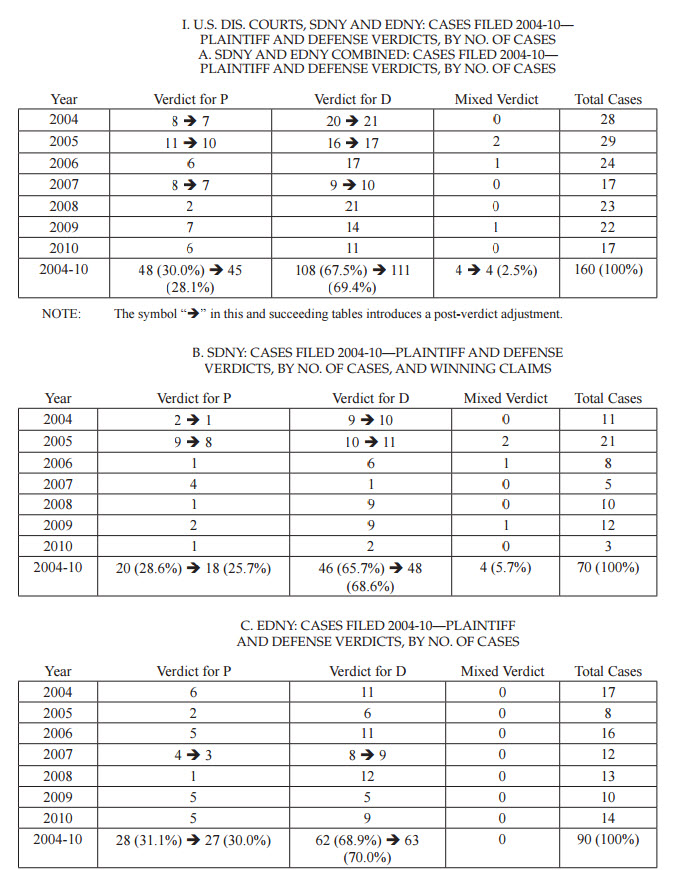
“The 160 cases in our data set yielded
48 verdicts for the plaintiff (30.0%), 108
verdicts for the defense (67.5%) and 4
mixed verdicts11 (2.5%).”
As earlier, we give win-loss results on both a per-case
and per-plaintiff basis and separately analyze success
rates for plaintiffs in public versus private actions. In
the prior study, we only reported win-loss statistics that
refl ected a truly fi nal resolution—after post-trial motions
and appeals. This time, we also recount verdicts (though,
as before, not directed ones). Attorneys may be concerned
with what the fact fi nder does, irrespective of fi nality, because
it affects the parties’ relative bargaining power. For
example, a winning plaintiff may relinquish some of her
recovery if the defense forgoes post-trial motions.
Once again, we report average and median emotional
distress and punitive damages numbers. But, deviating
from the original piece, this update does not relate the
amount of attorneys’ fees and costs. On reconsideration,
the numbers did not strike the author as very useful. They
do not refl ect juror proclivities since they are determined
by the judge; often, too, they are settled by the parties
before any award is made. Further, we again report the
average and median number of months from the date of
filing to the date of verdict;9 we also give outlying maximum
and minimum figures.
A closing word needs to be said about the so-called
censored data. These are data that may be altered by
events after the study’s completion, which have the
potential to change outcomes. At the time of writing, 13
cases from the data set remain open: six in the SDNY,
seven in the EDNY. This is a fairly small proportion of the
closed cases that we examined. Their ultimate disposition,
moreover, is unlikely to change our results meaningfully.
Even though “elderly” actions are likelier than average
to go to trial, in all probability very few, if any, will
do so. For one thing, consider the statistical landscape.
Very few lawsuits culminate in trials: between October 1,
2014 and September 30, 2015, only 3.4% of employment
discrimination cases in the Southern and Eastern Districts
of New York were tried to verdict: 2.3% in the former
and 5.3% in the latter.10 Then, too, take account of these
matters’ individual characteristics. Four of them have pro
se plaintiffs; the problems of dealing with such litigants
may well explain these actions’ longevity. Several of the
suits are pending on summary judgment. One matter returned
to the trial court after partial reversal of an earlier
dismissal. In other words, not many of these cases refl ect
an orderly march toward trial. Hence, we consider our
fi ndings quite stable.
The Study: Results
Who Wins, and How Often?
Win-Loss Rates
The 160 cases in our data set yielded 48 verdicts for
the plaintiff (30.0%), 108 verdicts for the defense (67.5%)
and 4 mixed verdicts11 (2.5%). Post-verdict adjustments
produced lower numbers for plaintiffs: 45 wins (28.1%);
there were 111 defendants’ victories (69.4%) and, as
before, 4 mixed results (2.5%).12 Notably, excluding pro
se matters, which are likelier to lead to plaintiff defeats,
plaintiffs prevailed 30.3% of the time (reduced to 29.0%,
on remittitur or appeal). That is hardly surprising since
unrepresented parties are extremely likely to lose at trial.13
Notably, the plaintiff victory rates in the two districts
were fairly close: 28.6% (25.7%)14 in the SDNY and 31.1%
(30.0%) in the EDNY.15 As can be seen, the latter, as well
as the overall net of pro se fi gures, more nearly approximate
a roughly one-third success rate than the former.
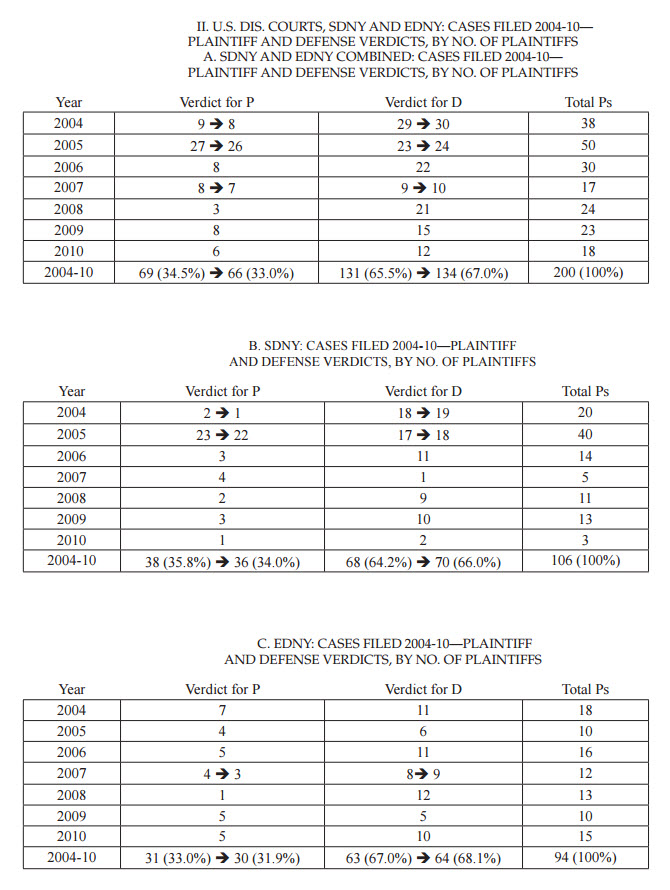
”Is the picture altered when we perform
an analysis based on number of plaintiffs
rather than number of cases? The answer
is yes.”
Another way in which the author looked at the data
was to examine success rates by number of plaintiffs
rather than number of cases. This was to see whether the
presence of multiple plaintiffs bore any relationship to
the outcome. In fact, to a small extent, it appeared to do
so. Of the total of 200 plaintiffs (106 in the SDNY, 94 in the
EDNY), 69, or 34.5%, won at trial; post-trial, there were
66 winners, or 33.0%.16 (Omitting the pro se cases, 34.9%
(33.8%) of plaintiffs prevailed.) Corresponding fi gures
for the Southern and Eastern Districts of New York were
35.8% (34.0%) and 33.0% (31.9%), respectively.17 Although
correlation is not tantamount to causation, it makes sense
that plaintiffs would fare better in tandem than alone:
each one’s story reinforces the others. Yet the likely “spillover”
effect has its limits. Hearing the testimony of several
claimants may attune the jury to the relative merits of
their cases, with the result that some suffer by comparison
with others. For example, in the SDNY there were mixed
results in three multi-plaintiff suits.18
Finally, a word should be said regarding the incidence
of different types of claims appearing in the plaintiff’s
victory column. Of the 61 discrimination-related claims
prevailing at the verdict stage,19 24 were for retaliation—
almost 40%. (The next two highest, sex at 13 and race/national
origin20 at 12, did not come close.) One cannot draw
too much from these numbers since no effort was made
to calculate how often each claim was brought. Yet the
relatively outsize number of retaliation victories suggests
the correctness of the common wisdom: it is often easier
to win on this ground than on a discrimination charge.21
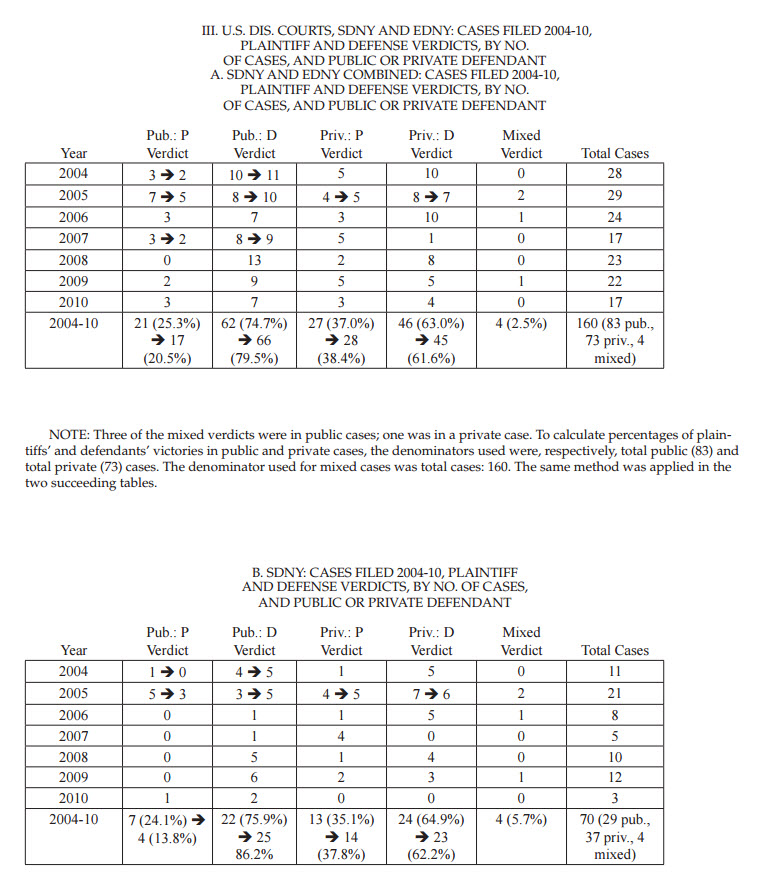
Private Versus Public Defendants
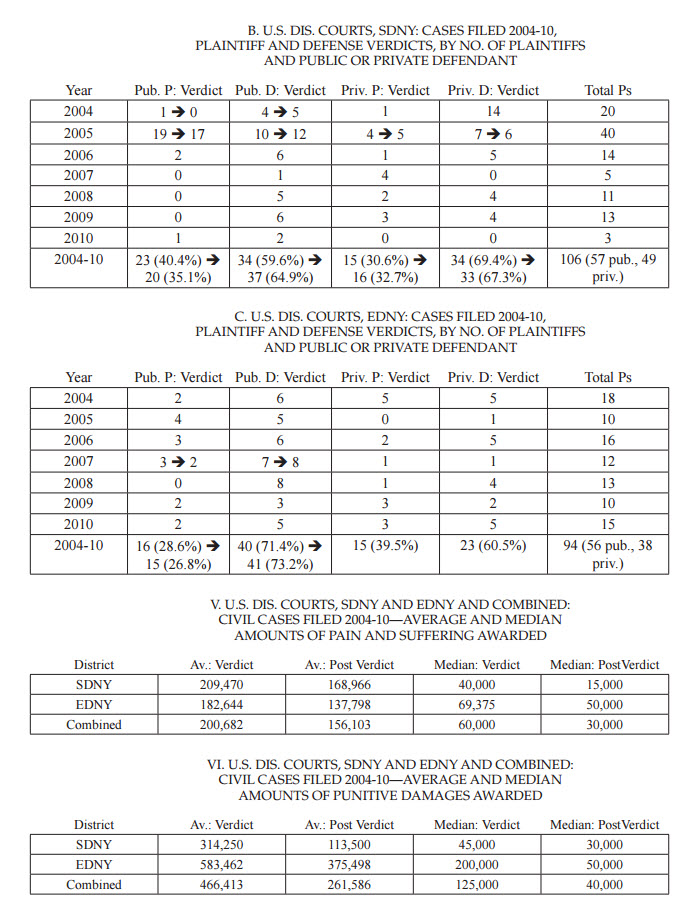
Our study also divides cases according to whether the
defendant is a private entity or governmental body. Overall,
of 160 cases, 86 were public and 74 were private.22
Excluding the four mixed verdicts, plaintiffs prevailed in
21 (17) of the public cases: 25.3% (20.5%).23 In the private
cases, they were victorious in 27 (28): 37.0% (38.4%).24
Again excluding the mixed verdicts (all of which occurred
in the Southern District), plaintiffs in public suits won
at trial in seven out of 29 cases, or 24.1%, in the SDNY;
after post-verdict adjustments, the fi gure was four out of
29, or 13.8%.25 Plaintiffs won 13 (14) out of the 37 private
actions: 35.1% (37.8%).26 Corresponding fi gures for the
EDNY were as follows: 14 (13) wins out of 54 public cases,
or 25.9% (24.1%); 14 victories in 36 private actions, or
38.9%; there were no post-verdict changes.27
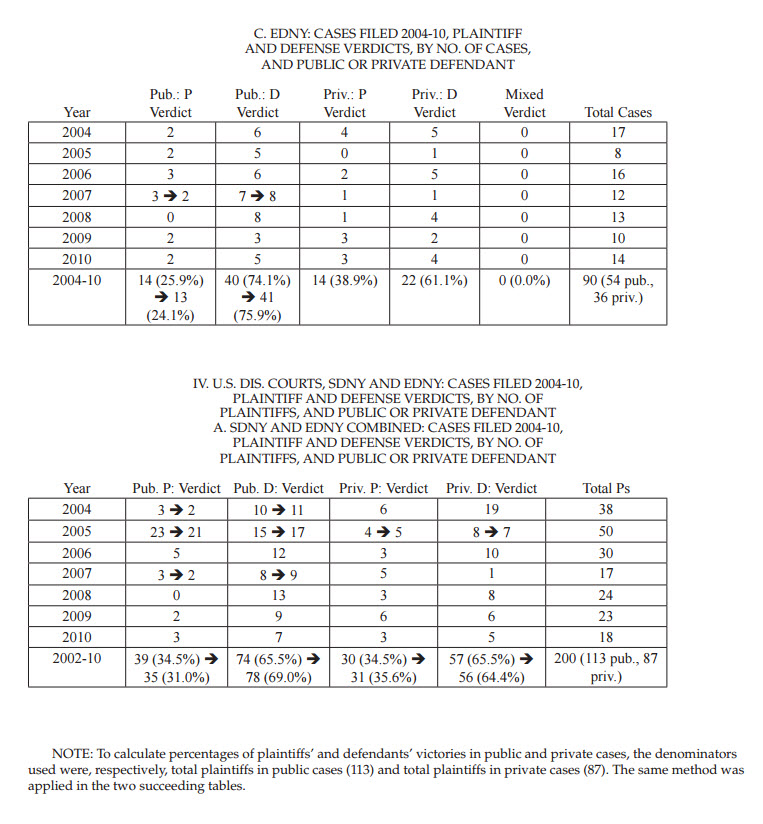
What do these data tell us? Clearly, plaintiffs fared
much better in suits against private entities. Is the picture
altered when we perform an analysis based on number of
plaintiffs rather than number of cases? The answer is yes.
The apparent disadvantage suffered by plaintiffs suing
the government largely vanishes when the results are
examined according to number of plaintiffs. Out of 113
total public cases, plaintiffs prevailed in 39 (35): 34.5%
(31.0%); they won 30 (31) of the 87 private matters: 34.5%
(35.6%).28 Thus, the putative “mutual reinforcement
effect” evinced in multi-plaintiff trials seemingly neutralized
any hypothesized negative effect encountered by
plaintiffs suing governmental entities.
This leads to the question whether the public-private
distinction makes an actual difference or whether it is
merely an artifact of our data set. The reality that very
large bodies like New York City, the Port Authority,
and school districts are sued very often benefi ts them in
litigation: “Repeat players” tend to do better than “oneshotters.”29
However, there are private defendants as
well as plaintiffs with little or no litigation experience—at
least, in the specialized employment arena. Given the
data’s mixed signals, we can arrive at no fi rm answer.
What Do Prevailing Plaintiffs Win?
Pain and Suffering Awards
Combined fi gures for the two districts yielded 63
awards for pain and suffering, 37 in the SDNY and 26 in
the EDNY. The average emotional distress award was
$200,682 ($156,103).30 The fi gures for the SDNY were
higher than the ones for the Eastern District: $209,470
($168,966),31 as opposed to $182,644 ($137,798).32 On account
of their sensitivity to outliers, especially large ones,
averages tend to be misleading. For example, a $4,000,000
verdict in the SDNY33 was $3,000,000 higher than the
next highest verdict; in its absence, the average would
have been only $108,173—slightly under half of the
actual average. In the EDNY as well, the highest verdict,
$2,150,000, skewed the average; without it, the average
would have been only $56,110, less than a third of the
actual one.
”Based on a survey of local federal and
New York trial court awards of punitives,
that study reinforces this one’s finding
that their prospects are dicey.”
Hence, a much more informative statistic for someone
who wants to calculate the probability of an emotional
damages award falling within a certain range is
the median dollar amount. (The median is the middle
value or values of a distribution.) The combined median
for the two districts was $60,000–$30,000 after postverdict
changes.34 The median for the SDNY was $40,000
($15,000) and, for the EDNY, $69,37535 ($50,000).36
Plainly, most plaintiffs, even if they win, cannot
expect to obtain a huge amount for pain and suffering.
Since media reports often exaggerate both success rates
and monetary recoveries of plaintiffs, these litigants frequently
need emphatic reality checks from their lawyers
and neutrals.37
Punitive Damages
Mediators often hear plaintiffs’ lawyers predict a
punitive damages award in the event a case goes to
trial—even in quite routine matters. The numbers do not
bear them out. In a total of only 22 cases, 13.8% of our 160
cases, was the jury even asked to assess punitives. The
average amount granted at verdict was $466,413 overall:
$314,250 in the SDNY38 and $583,462 in the EDNY.39
In four instances, the jury gave $0, resulting in a ratio
of punitive awards to total cases of merely 11.3%. After
post-verdict adjustments, the overall average declined
to $261,586. In the EDNY, the fi gure was $113,500; in the
SDNY, $375,498.40
“Stake asymmetry arises when repeat
players in litigation confront opponents
who are not. Because of concerns such
as precedent and reputation, habitual
litigants have greater stakes than ‘oneshotters’;
they also have a better chance
of victory.”
The more signifi cant median award at trial was
$125,000 for the two districts combined. For the SDNY it
was $45,000;41 for the EDNY, it was $200,000.42 As usual,
post-verdict events brought disappointment to plaintiffs:
the overall median declined to a mere $40,000-$30,000
in the Southern District43 and $50,000 in the Eastern
District.44
Notably, at about the same time as the original piece
on employment discrimination trials, the author published
an article devoted solely to the subject of exemplary
damages.45 Based on a survey of local federal and New
York trial court awards of punitives, that study reinforces
this one’s fi nding that their prospects are dicey. We wrote
there that “only in 27 of the 34 actions yielding punitives
(79.4%) did the prevailing party or parties hold onto at
least part of the award; the fi gure was 14 out of 34 (41.2%)
for awards that survived unchanged.”46 Thus, among
plaintiffs who did garner substantial punitive damages
verdicts, more ended up as weepers than keepers.
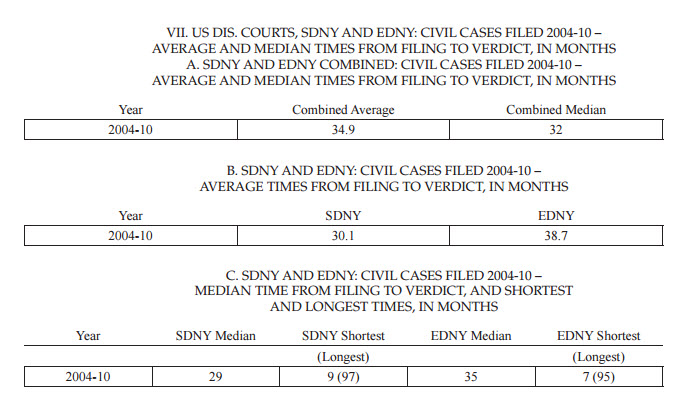
How Long Does It Take From Filing to Verdict?
The average time from fi ling of the complaint to
verdict in the two districts was 34.9 months; only slightly
less, the median was 32 months.47 The fi gures for the
Southern and Eastern Districts were: 30.1 months average
and 29 median (SDNY); 38.7 months average and
35 median (EDNY).48 The original article, with numbers
from only 2004-05, reported a combined average of 33.7
months; 30 months was the combined median.49 The
elapsed time from fi ling to verdict has, therefore, grown
only slightly with the increase in years included.
”In closing, we stress that our claims for
our work are fairly modest.”
Parties should, thus, be counseled to expect the passage
of two and three quarter years or more before they
can hope to obtain a trial on the merits. But meaningful
plaintiffs’ wins, in particular, will likely elicit post-verdict
motions and, if the defense loses, appeals. Often these
will extend considerably the time for parties to achieve
closure.
Yet even if a prevailing plaintiff clears post-trial legal
hurdles with verdict unscathed, other factors may cause
complications that keep the victor from enjoying the
spoils. For instance, in one unappealed case, a plaintiff
obtained satisfaction of judgment more than 11 months
after the verdict. In another matter, affi rmed on appeal,
a plaintiff had her judgment satisfi ed almost three years
following the verdict. Some judgments are never collected.50
Hence, the time from fi ling to verdict provides a
most inadequate measure of how long it actually takes to
secure a fi nal disposition of the action.
Conclusion
Both theory and practical experience counsel that the
suits that survive to verdict do not represent disputes in
general. The seminal Priest-Klein hypothesis predicts that
the extreme cases—ones that plainly favor the plaintiff or
the defendant—will tend to be resolved by settlement.51
The model also posits that the weeding out of cases
at either end of the spectrum will lead to an approximately
even split in verdicts for plaintiffs and defendants.52
Granted, our findings of a plaintiff success rate approaching
one-third do not bear out the 50-50 outcome prediction.
Yet this conclusion applies only to parties who have
an equal stake in the dispute and “equivalent information,
experience and skill.”53 Stake asymmetry arises
when repeat players in litigation confront opponents who
are not.54 Because of concerns such as precedent and reputation,
habitual litigants have greater stakes than “oneshotters”;55
they also have a better chance of victory.56 As
compared with the average plaintiff, the mainly institutional
defendants in employment discrimination cases
are typically seasoned, high-stakes repeaters.57 Hence, it
comports with theory as well as common sense that they
win, and plaintiffs lose, more than half of the time. Further,
as recounted in the predecessor to this study, other
research corroborates our ballpark conclusions.58
In closing, we stress that our claims for our work are
fairly modest. Statistics can do no more than provide a
useful background, not substitute, for detailed analysis of
one’s own case. Experienced practitioners should have a
fairly good idea of their own witnesses’ likely appeal to a
jury, the range of potential damage awards, the proclivities
of the presiding judge, and all of the other tangible
and intangible factors affecting the decision when to
settle and on what terms. We hope that our fi ndings will
usefully contribute to the overall efforts of attorneys and
neutrals to provide a reality check to their clients confronted
with the daunting prospect of trial.
Endnotes
-
See Vivian Berger, Winners and Losers: Employment Discrimination
Trials in the Southern and Eastern Districts of New York, 37 NYSBA
LAB. & EMP. L.J. 42 (Spring 2012). The United States District Courts
for the Southern and Eastern Districts of New York will be abbreviated as
SDNY and EDNY.
-
See, e.g., Kevin M. Clermont & Stewart J. Schwab, Employment
Discrimination Plaintiffs in Federal Court: From Bad to Worse?, 3
HARV. L. & POL’Y REV. 103, 110 (2009); Kevin M. Clermont &
Stewart J. Schwab, How Employment Discrimination Plaintiffs Fare in
Federal Court, 1 J. EMPIRICAL LEGAL STUDIES 429 (2004); Michael
Selmi, Why Are Employment Discrimination Cases So Hard to Win?, 61
LA. L. REV. 555 (2001). The data are better for federal courts, which
generally keep more reliable statistics.
-
Minna Kotkin, Diversity and Discrimination: A Look at Complex Bias,
50 WM. & MARY L. REV. 1439, 1445 (2009).
-
See Vivian Berger, Employment Mediation in the Twenty-First Century:
Challenges in a Changing Environment, 5 U. PA. J. LAB. & EMP. 489,
499-503 (2003).
-
While this article replicates much of the original one in format and
substance, though substituting updated numbers, it does not repeat the
material on other studies reporting verdicts in employment actions.
Interested readers are referred to Section IV of the previous article (“Prior
Verdict Studies”). See supra note 1, at 44-46.
-
The fi ndings have less immediate relevance to state court trials. But as
we have previously noted, other sources tend to support the ballpark
reliability of the win-loss ratios we identify. See text accompanying note
5 and note 5, supra.
-
We excluded class actions. It is interesting to note that Judge Leonard D.
Wexler—who virtually never grants summary judgment in employment
matters—heard a total of 19 of the 90 cases in the Eastern District—21%.
Of the 2006 tried cases, Judge Wexler was responsible for seven, almost
44%. Taking his cases out of the mix would reduce the EDNY trial rate
for the whole period from 3.2% to 2.5%, bringing it much closer to the
SDNY fi gure.
-
In the earlier study, we had only 78 plaintiffs, 50 in the SDNY and 28 in
the EDNY.
-
Our reasoning for choosing the time of verdict as an endpoint instead
of other possible dates (e.g., judgment, or appellate decision, if any) are
detailed in the earlier piece. See supra note 1, at 42-43.
-
Personal communication on Nov. 9, 2016 from Joe S. Cecil in the
Division of Research, Federal Judicial Center (FJC), Wash. DC. (based
on an analysis of the FJC’s Integrated Data Base). These are employment
discrimination actions, not involving a U.S. plaintiff or defendant (Pacer
designation of Nature of Suit: 442).
-
The study counts as a plaintiff victory any action in which the plaintiff
won at least one discrimination (or retaliation) claim. Mixed verdicts
involved cases with multiple plaintiffs, in which some won and some
lost. See Table IA.
-
Id. An approximate 95% confi dence interval for the 30.0% proportion
of plaintiff wins is 22.6%-37.4%; for the adjusted fi gure of 28.1%, it is
20.8%-35.4%.
-
In the EDNY there was one pro se who actually did prevail at trial.
However, on appeal, the defendant was granted judgment as a matter of
law.
-
Henceforth, where numbers appear in parentheses, they indicate the tally
after any post-verdict adjustments.
-
See Table IB, IC.
-
See Table IIA.
-
See Table IIB, IIC.
-
In one case, seven plaintiffs lost and four prevailed. In another, seven
plaintiffs won; two lost. In a third, two plaintiffs were victorious and fi ve
were not. In the two remaining multi-plaintiff lawsuits, two plaintiffs
won and two plaintiffs lost. In the EDNY, by contrast, all plaintiffs
rose and fell together. In one case, two plaintiffs won; in another, three
plaintiffs prevailed. In a third, two plaintiffs lost.
-
These were taken on a per-case basis from our 160 total cases.
-
The study lumped race and national origin together since often, as the
complaint was framed, it was hard to distinguish one from the other.
-
But cf. V. Berger, M. Finkelstein & K. Cheung, Summary Judgment
Benchmarks for Settling Employment Discrimination Lawsuits, 23
HOFSTRA LAB. & EMP. L.J. 45, 59-63 (2005) (with respect to
surviving summary judgment, sex claims did substantially better than
other claims—including those of retaliation).
-
See Table IIIA.
-
Id.
-
Id.
-
See Table IIIB.
-
Id.
-
See Table IIIC.
-
See Table IVA. In the SDNY, plaintiffs in public cases won 40.4%
(35.1%) of the time; in private cases, they prevailed 30.6% (32.7%)
of the time. See Table IVB. Corresponding fi gures for the EDNY were
28.6% (26.8%) and 39.5%; there were no post-verdict adjustments in the
latter. See Table IVC.
-
See generally Marc Galanter, Why the “Haves” Come Out Ahead:
Speculations on the Limits of Legal Change, 9 LAW & SOC’Y REV. 95
(1974).
-
See Table V.
-
Id. One remittitur was granted by the trial court because a federal fee
cap applied. (Such caps do not pose a risk to plaintiffs who prevail under
either New York State’s or New York City’s anti-discrimination laws.) In
two instances, prevailing plaintiffs ended up with no emotional distress
damages because the defendant was later awarded judgment as a matter
of law. In another case, the appellate court vacated seven plaintiffs’
pain and suffering awards; the parties ultimately settled. Indeed, a
confi dential settlement was reached post-verdict in several cases. There
may, in addition, be more settlements that do not appear in the record.
Settlements, moreover, may allocate sums differently than the fact-fi nder
did. Hence, the import of the verdict numbers is limited. But they at least
give some indication of the plaintiff’s bargaining power in negotiating a
resolution.
-
Two settlements were included under this heading since, contrary to
the usual practice, the record revealed the reduced amounts of pain and
suffering.
-
See Osorio v. Source Enterprises, Inc., 2007 WL 683985 (SDNY)
(stating reasons for court’s denial of judgment as a matter of law, new
trial, and remittitur).
-
See Table V.
-
This was the average of $63,750 and $65,000. An average had to be
taken because the number of awards was odd: i.e., there was no one
middle value. In tallying both averages and medians (with respect to
punitives as well as emotional distress damages), the author included
verdicts of $0 where it appeared that the jury had been given the option
of returning a pain and suffering (or punitive damages) verdict but had
simply chosen not to do so or had expressly awarded nothing. Judgment
calls in a number of cases may have reduced our numbers’ reliability.
-
See Table V.
-
See Laura Beth Neilsen & Austin Beim, Media Misrepresentation: Title
VII, Print Media, and Public Perceptions of Discrimination Litigation, 15
STAN. L. & PUB. POL’Y REV. 237 (2004).
-
In one case (not part of the tabulation), the judge withdrew punitives from
the jury’s consideration because the plaintiff had also won $3,500,000
on a defamation claim. Had the jury had the option, it likely would also
have rendered a substantial award of punitives on her retaliation claim.
In a second, the jury found that punitive damages were warranted but left
it to the court to determine the amount; the matter ended up settling. As
with pain and suffering, post-verdict settlements make it impossible to
know what many plaintiffs actually received in the end. See supra note
-
Moreover, on account of the paucity of cases in which the fact fi nder
was permitted to award punitives, even medians are not very meaningful;
averages, of course, are still less so.
-
See Table VI.
-
Id.
-
$45,000 was the average of $40,000 and $50,000. See supra note 35.
-
See Table VI.
-
$30,000 was the average of $20,000 and $40,000. See supra note 3. In
one case, a $125,000 punitive damages verdict was remitted to $50,000
because of a fee cap. As previously noted, see supra note 20, neither New
York State nor New York City law has such caps. The former, however,
does not authorize punitive damages.
-
Id. On account of a statutory cap, one $500,000 punitive damages verdict
was remitted to $50,000.
-
See Punitive Damages in Employment Discrimination Cases: Myth or
Reality, 37 NYSBA LAB. & EMP. L.J. 6 (Fall/ Winter 2012).
-
Id. at 8.
-
See Table VIIA.
-
See Table VIIB, VII C.
-
See Berger, supra note 1, at 44.
-
If the defendant declares bankruptcy, it may often take years for the
plaintiff to recover, in the end, little or nothing. It is worth noting that
the six cases tried to the court in the SDNY were heard 38, 36, 16, 17,
43, and 11 months after fi ling. The three cases tried to the court in the
EDNY were heard 22, 27 and 84 months after fi ling. Signifi cantly, neither
the average elapsed time, 32.7 months, nor the median elapsed time, 27
months, is far out of line with the overall statistics – getting a bench trial,
thus, took only slightly less time than obtaining a trial by jury.
-
See George L. Priest & Benjamin Klein, The Selection of Disputes For
Litigation, 13 J. LEGAL STUD. 1 (1984). In real life, though, stubborn,
inexperienced or poorly represented litigants may furnish the exception to
the rule.
-
Id. at 4-5. See also Minna J. Kotkin, Outing Outcomes: An Empirical
Study of Confi dential Employment Discrimination Settlements, 64 WASH.
& LEE L. REV. 111, 116 (2007); Wendy Parker, Lessons in Losing: Race
Discrimination in Employment, 81 NOTRE DAME L. REV. 889, 912-13
(2006).
-
See Samuel R. Gross & Kent D. Syverud, Getting to No: A Study of
Settlement Negotiations and the Selection of Cases For Trial, 90 MICH.
L. REV. 319, 325 (1991).
-
See Peter Siegelman & Joel Waldfogel, Toward a Taxonomy of Disputes:
New Evidence Through the Prism of the Priest/Klein Model, 28 J.
LEGAL STUD. 101, 109-11 (1999).
-
Id.
-
See Priest & Klein, supra note 51, at 24-25. Explanation of why higher
stakes infl uence victory falls beyond the scope of this article.
-
See Siegelman & Waldfogel, supra note 54, at 109.
-
See text accompanying note 5 and note 5, supra.
Tables
Vivian Berger, Esq. is the Nash Professor of Law
Emerita at Columbia Law School. She has conducted
hundreds of mediations since the mid-1990s and been
designated an Advanced Practitioner in employment
mediation, her focus, by the ACR. She thanks Michael
O. Finkelstein, Esq. for his assistance on statistical
matters.

|