|
 |
|||||||
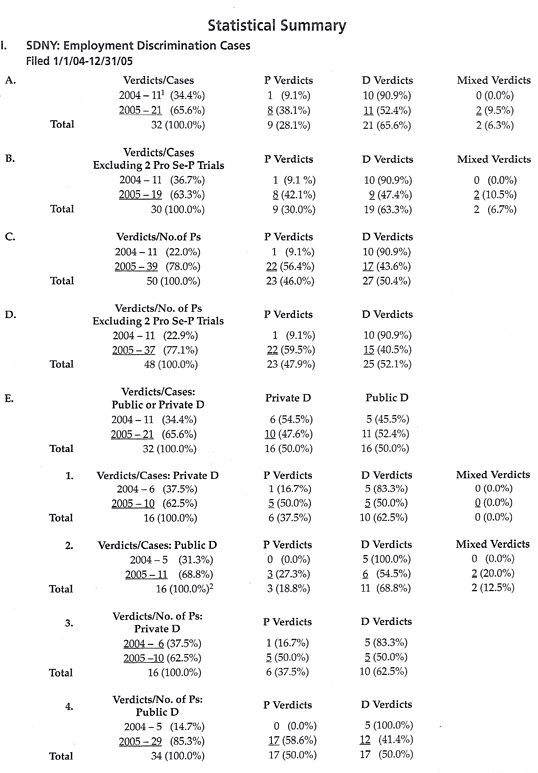
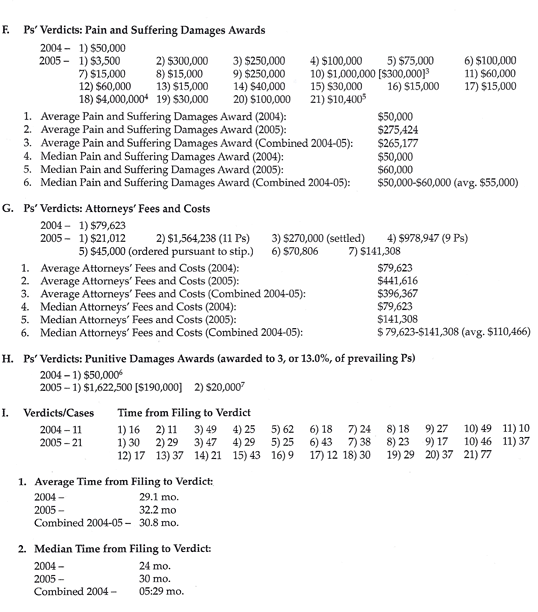
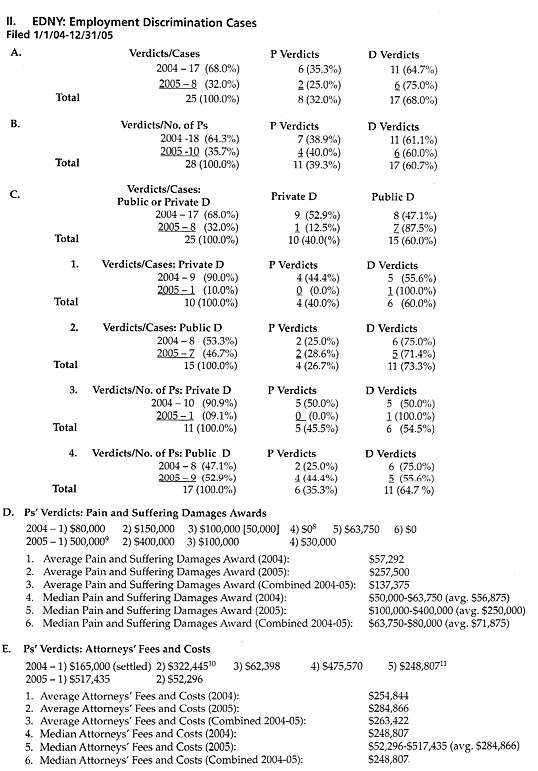
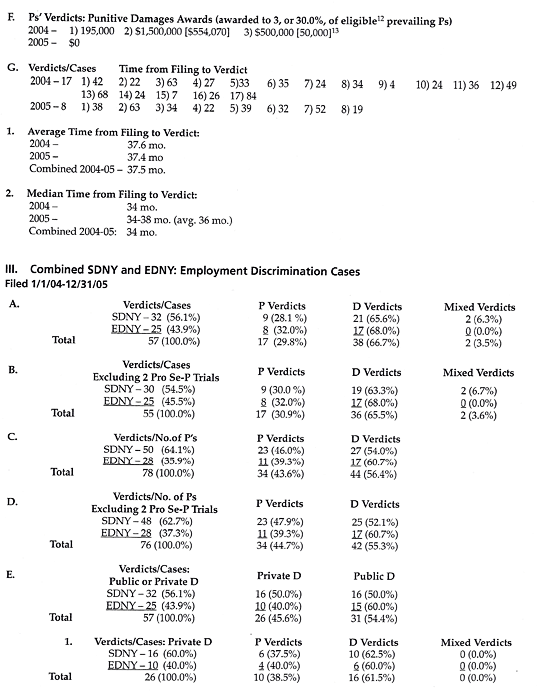
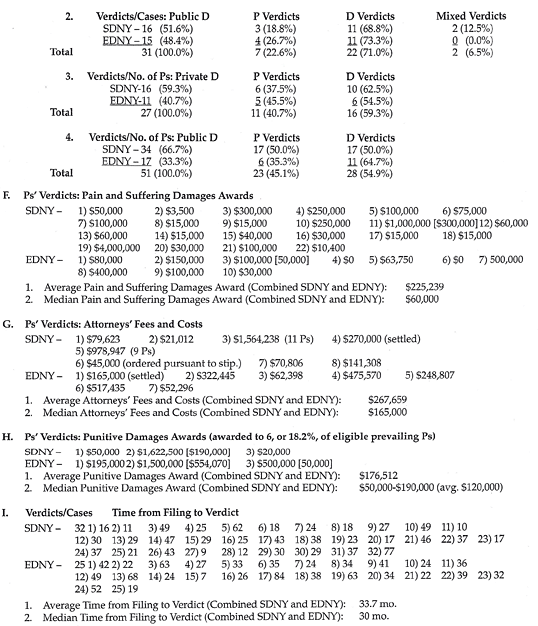
Home « Mediation, Employment, Civil Rights « Employment Discrimination Trials Winners and Losers: Employment Discrimination Trials in the Southern and Eastern Districts of New YorkNYSBA Labor and Employment Law Journal I. IntroductionScholars and practitioners have long known that employment discrimination plaintiffs have a difficult row to hoe. They fare poorly, both in comparison with plaintiffs in other types of actions and absolutely — losing much more often than winning. That is true at all stages of litigation: pre-trial, trial and appeal. Many studies have documented this state of affairs, [1] especially with regard to federal courts [2] since these keep generally reliable statistics. Some writers have speculated about the causes of the phenomenon. Reasons cited have ranged from biased decision makers and overly defendant-friendly doctrine [3] to multiple practical considerations lending an advantage to the employer.[4] Parties, advocates and neutrals, however, are usually less concerned with the "why" than the "who" and "how much": who prevails, and to what extent? The better the players can quantify the risk-adjusted value of a case (or, from the opposite point of view, the defendant's exposure), the better they can decide the terms on which they should settle. Moreover, the sooner they can do so, the more they can save in transaction costs — above all, attorneys' fees. The author, having previously written on the incidence of summary judgment in employment discrimination actions in New York's downstate federal courts, [5] has often been asked what happens to the ones that clear this hurdle if they actually go to trial. (Denial of a dispositive motion tends to focus the defense on making serious efforts to resolve the matter.) This paper attempts to answer that question in a number of respects. Although the small number of verdicts, as compared with summary judgment decisions, precluded performing the sophisticated statistical analysis conducted in the earlier study, the results reported in this piece should still give some useful guidance to those wishing to assess the risks or rewards of trial. II. The Study: MethodologyThe on-line system PACER affords access to docket sheets and documents in cases in the federal judicial districts. Among the parameters one can search are Case Status (open or closed), Filed Date, and Nature of Suit. The author retrieved all lawsuits under the headings 442 (Civil Rights: Jobs) and 445 (Americans with Disabilities - Employment), filed from January 1, 2004 through December 31, 2005 in the Southern and Eastern Districts of New York (SDNY and EDNY). Among closed cases, those culminating in a jury verdict or findings and conclusions by the judge at a bench trial (also referred to here as "verdicts") were winnowed out and tabulated. This inquiry yielded a combined total for the two years of 57 trials: 32 in the SDNY; 25 in the EDNY. Since several cases had multiple plaintiffs and, occasionally, mixed verdicts — some plaintiffs, prevailing, others losing — the figures were further broken down to reflect the actual number of plaintiffs in these trials. There were 78: 50 in the SDNY; 28 in the EDNY. Finally, the study also disaggregates defendants into private and public entities. From these figures, we compiled win-loss statistics. The final resolution on post-verdict motions or appeal determined winners and losers, but directed verdicts were not counted. This choice is, of course, debatable; some may be interested simply in what the fact-finder does. Yet it seems disingenuous to call an interim decision a victory. Combatants would rather carry the day in the war than a battle. In any event, only four results changed after trial (all in the SDNY). [6] The article also reports awards (total, average and median amounts, post-remittitur) for pain and suffering and, where available, plaintiffs' attorneys' fees and costs, as well as the few instances of punitives. While it might have included economic damages in addition, these were omitted because back pay at least is determined by largely objective factors that the people involved can readily calculate. (Although this is less true of front pay, the matter is trivial since only three plaintiffs obtained future economic damages.) Further, such figures would have indicated plaintiffs' former and interim earnings and their periods of unemployment more than the intangible predilections of judges and juries that a study like this one tries to uncover. Last, the author recorded the time from filing to verdict — once more, total, average and median; this is approximated in months. From the parties' perspective, it might be more meaningful to chart the time from filing to termination of the case since closure is not actually attained until the disposition of post-trial motions or an appeal. However, using the time to judgment would involve deciding which judgment "counts" when, for example, a preliminary judgment embodies the verdict the jury returns, an amended judgment conveys the decision on post-verdict motions, and a later judgment or order relates to matters like attorneys' fees, costs and interest. (The Pacer category Date Terminated does not consistently reflect any of these possible dates.) In addition, many judgments are not appealed. The date of verdict thus has the virtue of being ascertainable in every case. In tried cases, it represents the minimum time from commencement of the action to what is colorably a disposition. A closing word needs to be said about the so-called censored data. These are data that may be altered by events after the study's completion, which have the potential to alter outcomes. At the time of writing, six lawsuits filed in 2004 are still open -- one only technically so, since it remains on the court's suspense docket pending the outcome of arbitration. [7] Further, out of the 2004 EDNY data set, one defense verdict is on appeal. Plaintiffs are also appealing two verdicts as well as two summary judgment grants arising from 2005 cases. [8] While the number of actions still unconcluded is not de minimis, viewed in context these it does not pose a significant risk of undercutting the study's results. The Administrative Office of the U.S. Courts reported that in 2006 only 3.2% of employment civil rights suits concluded by trial. [9] That office's statistics reveal, too, that appellate courts reverse defendants’ trial wins less than 9% of the time; their pretrial victories are overturned in fewer than 11% of appeals. [10] In light of these realities, our numbers appear to be quite stable. III. The Study: Results [11]A. Who Wins, and How Often?1. Win-Loss Rates. The 57 cases in our data set yielded 17 verdicts for the plaintiff (29.8%), 38 verdicts for the defense (66.7%), and two mixed verdicts (3.5%) (III.A). [12] The plaintiff victory rates in the districts are fairly close: 28.1% for the SDNY and 32.0% for the EDNY. The win rates for defendants were 65.6% (SDNY) and 68.0% (EDNY), respectively. (In the SDNY, the two mixed verdicts, which amounted to 6.3% of that district's total verdicts, account for the fact that plaintiff and defendant success rates add up to less than 100%.) Because a plaintiff's lack of legal representation virtually guarantees defeat, the author performed an alternative calculation omitting the two pro se trials in the SDNY (III.B). In this scenario, plaintiffs’ victories rose to 30.0% in the SDNY and 30.9%, overall. Generally, the study reveals that plaintiffs win in nearly a third of the cases — 29.8% or 30.9%, depending on whether one counts the pro ses. But the underlying data do suggest a note of caution. While the rates for the sample years in the EDNY did not differ substantially (plaintiffs prevailed 35.3% of the time in 2004 and 25.0% in 2005) (II.A), they diverged dramatically in the SDNY. In 2004, plaintiffs lost in all but one of eleven trials, scoring only 9.1%; in 2005, they won in 8 of 21 trials, 38.1% of the time(I.A). [13] Very likely, 2004 was simply an unusual year in that district. A larger data base — more years — would lessen the importance of annual variations. Yet as we will see in the next section, statistics obtained from other sources give some reason for confidence in a figure in the vicinity of one-third. Another way in which the author looked at the data was to examine victory rates by number of plaintiffs rather than cases in order to see whether the presence of multiple plaintiffs had any relationship with outcome. In fact, it did. Of the 78 plaintiffs (there were four multi-plaintiff trials, two apiece in each of the districts), a total of 34, or 43.6% [14], prevailed: 46.0% in the SDNY and 39.3% in the EDNY (III.C). Although correlation is not tantamount to causation, it makes sense that plaintiffs would fare better in tandem than alone: each one's story reinforces the others'. Yet the likely "spillover" effect has its limits. Interestingly, the two multi-plaintiff lawsuits in the SDNY produced mixed verdicts. In one of them, seven plaintiffs won and four lost; in the second, seven won and two lost. [15] Maybe hearing the testimony of numerous claimants attuned the juries to the relative merits of their cases, with the result that some suffered from comparison with others. Finally, a word should be said about the prominence of retaliation claims in the plaintiff’s victory column. Plaintiffs prevailed on this cause of action in thirteen of the seventeen cases they won — 77.5% of the time. [16] Of the 34 victorious plaintiffs, 20(58.8%) were successful on this ground. [17] 2. Private Versus Public Defendants Finally, the study divides cases according to whether the defendant is a private entity or a governmental body. Twenty-six (45.6%) fell into the former category and 31 (54.4%) into the latter (III.E). At first blush, plaintiffs did better when they confronted a private defendant: ten out of 26 (38.5%) won (III.E.1), as opposed to seven out of 31 (22.6%) of those who sued a public employer (III.E.2). [18] Breaking down the numbers by district, one finds that plaintiffs in the SDNY had a 37.5% win rate against private institutions (III.E.1), compared with an 18.8% win rate against public bodies (III.E.2). The EDNY showed success rates for private-sector plaintiffs of 40.0% (III.E.1), as opposed to 26.7% for ones in the public sector (III.E.2). Yet the apparent disadvantage suffered by plaintiffs suing the government disappears when verdicts are analyzed by number of plaintiffs, not just cases. Eleven out of 27 plaintiffs (40.7%) prevailed in private-entity cases (III.E.3). But of 51 plaintiffs suing public defendants, [19] 23 (45.1%) won (III.E.4) — roughly twice the percentage produced by tabulating cases alone. The putative "mutual-reinforcement effect" evinced in multi-plaintiff trials seemingly neutralized any hypothesized negative effect encountered by public-sector plaintiffs. This leads to the question whether the public-private distinction makes an actual difference, or whether it is merely an artifact of the relatively small amount of data. (The difference is not statistically significant.) One might imagine that the fact that very large bodies like New York City, the Port Authority, and school districts are sued very often benefits them in litigation; "repeat players" tend to do better than "one-shotters." [20] By contrast, there are private defendants who have little or no experience with lawsuits — at least in the specialized employment arena. Given the mixed signals, however, we can arrive at no firm answer. B. What Do Prevailing Plaintiffs Win? 1. Pain And Suffering Awards Combined figures for the two districts yielded 32 pain and suffering awards — 22 for the SDNY, ten for the EDNY — of which two had been reduced by remittitur. [21] The average emotional distress verdict was $225,239 (III.F.1). In the SDNY, the number was higher, but not substantially: $265,177 (I.F.3). The much lower number in the EDNY was $137,375 (II.D.3). Because of their sensitivity to outliers, especially large ones, averages tend to be misleading. Indeed, if one removes the biggest and smallest awards ($4,000,000 [22] and $0.00, respectively), one arrives at an overall average of $106,922. Correspondingly "trimmed" data from the districts produce averages of $91,520 for the SDNY and $109,219 for the EDNY — a reversal in the sense that the EDNY’s average now exceeds the SDNY’s. A more informative statistic for someone who wants to calculate the probability of an emotional damages award falling within a certain range is the median dollar amount. (The median is the middle values or values in a distribution). The combined median was $60,000 (III.F.2). The median in the SDNY was $50,000 (I.F.6); in the EDNY, it was $63,750-$80,000 (IID.6). Plainly, most plaintiffs, even if they win, cannot expect to obtain a huge amount for pain and suffering. Since media reports often exaggerate both success rates and monetary recoveries of plaintiffs, [23] these litigants frequently need emphatic reality checks from their attorneys and mediators. 2. Attorneys' Fees And Costs Although 17 cases from our data set resulted in a plaintiff's verdict, the author could find only fifteen reports of the sum received on account of attorneys' fees and costs. (This is unsurprising because amounts arrived at by settlement will not generally appear on PACER in matters involving a private defendant.) The average amount, which included two-agreed-upon numbers, both in the SDNY, was $267,659 (III.G.1). The district averages came to $396,367 in the SDNY (I.G.3) and $263,422 in the EDNY (II.E.3). Large outliers again skewed the averages upward. The somewhat more informative medians were $165,000(combined districts) (III.G.2), $79,623-$141,308 (SDNY) (I.G.6), and $248,807 (EDNY)(II.E.6). 3. Punitive Damages Mediators often hear plaintiffs' lawyers predict a punitive damages award in case of trial — even in quite routine cases. Our statistics do not bear them out. Only six, or 18.2%, of prevailing claimants received punitives (III.H). (Five were retaliation claimants; the sixth had won on sexual harassment.) The average award was $176,512 (III.H.1); the median, $50,000-$190,000 (average $120,000) (III.H.2). Significantly, the two extremely large amounts ended up heavily discounted: one, over $1.6 million, fell to $190,000, and another, $1.5 million, to $554,070, on remittitur; a third large award of $500,000 was reduced to $50,000 because of a statutory cap. Notably, such caps do not pose a risk to plaintiffs who prevail under New York State’s or New York City’s anti-discrimination law. (But the former does not authorize punitive damages.) C. How Long Does It Take From Filing To Verdict? The average time from filing of the complaint to verdict was 33.7 months in the two districts (III.I.1); the median was 30 months(III.I.2). The SDNY had an average and median, respectively, of 30.8 months (I.I.1) and 29 months (I.I.2). The corresponding figures for the EDNY were 37.5 months (II.G.1) and 34 months (II.G.2). (Seven months was the shortest period recorded in our data base and 84 months (!) the longest; both these trials took place in the EDNY (III.I).) Generally speaking, litigants should be counseled to expect the passage of at least two and a half years before they can hope to see a verdict. But meaningful victories, in particular, will probably elicit post-verdict-motions and, if the defense loses, appeals. Thus even if a prevailing plaintiff clears these hurdles with verdict unscathed, the time it will take to lay hands on the money — though not quantified in this study — will, of course, be much longer. IV. Prior Verdict Studies1. Limits Of Usefulness To the extent a study draws on an extensive data base, it generally inspires more confidence in its results. Supplementation of our work by others' research could expand our data both temporally and geographically. However, on the downside, such expansion risks concealing material differences among time periods and locations. There have been many studies reporting verdicts in employment actions. Different ones rely on different sorts of data: some national, [24] some local [25]; others state [26] or state and federal. [27] They cover diverse periods of time. A number rely on published decisions [28] or lawyers' accounts, [29] while others obtain information directly from case files or governmental sources like Pacer or the Administrative Office of the U.S. Courts. [30] Some deal with all types of employment disputes, [31] while others deal solely with discrimination. [32] Predictably, the data sets vary in reliability. For example, systematically compiled federal statistics, spanning years, are more likely to be trustworthy than those available from government bodies in most states. "Raw" data do not pose the problem of "publication bias" presented when a researcher uses decisions culled from case reports. [33] Information obtained from volunteer non-neutral parties like litigants' lawyers will be less representative, hence less reliable, than data procured from impartial sources. (These are particularly inclined to yield disproportionate numbers of plaintiff verdicts, especially ones with high damages.) [34] Moreover, even dependable studies may suffer from a lack of comparability to each other and to one's own. First, authors utilize various coding conventions. Some, for instance, like us, count events after the verdict but do not consider directed verdicts in tabulating wins and losses; others use a different approach. [35] Then, the cases comprising the data base may rely on divergent law. Even if one sets aside changes in doctrine over time, [36] the differences between state and municipal anti-discrimination statutes, where these exist, and federal law may undermine cross-regional comparisons [37]; so, too, may conflicting precedents handed down by the federal Courts of Appeal. In addition, dissimilarities in local culture surely affect trial results. In sum, geography matters — a lot. [38] 2. Selected Results a. Verdict Rates Because of the salience of location, as well as similarity in methodology, perhaps the most instructive comparator to our study is one done by the law firm Orrick Herrington & Sutcliffe of cases in the SDNY. As did we, the Orrick researchers examined PACER docket sheets for the relevant job discrimination categories. They looked for verdicts resulting from filings between December 1, 1999 and July 31, 2001; they did not take account of post-trial changes. [39] These amounted to 54 (a number almost the same as our total from both districts: 57). The plaintiff prevailed in 15 (27.78%) of the cases. [40] In our slightly later period, the comparable figures were 28.1% (SDNY) and 29.8% (combined districts). On their face, the two sets of results are similar enough to fall within sampling error. A caveat, however: a previous Orrick report on results from a slightly earlier period yielded a success rate for plaintiffs of 38%. [41] Significantly, a number of other verdict surveys in federal courts, of varying degrees of comparability and reliability, producewin rates by employment plaintiffs ranging from 28.5% to 39.9%. [42] These lend rough support to our 29.8% finding (30.9%, excluding pro ses) in the two districts studied. b. Plaintiffs' Monetary Recoveries With regard to damages, the problems in comparing others' findings to ours become almost insurmountable. For one thing, authors almost never clearly report what their numbers represent. Terms such as "total jury award" may or may not include back pay — or may do so inconsistently, according to particular judges' practice respecting who makes this determination. Occasionally, too, writers use "jury" as a shorthand for lay and judicial decision makers. Even "total award" does not always include attorneys' fees and costs, while "compensatory" might refer to non-economic or economic damages or both. Furthermore, when surveys cover different time spans, true comparability would necessitate using constant dollars. (Some studies do so.) Finally, we do not know to what extent verdicts were lowered on account of damages caps inapplicable to cases governed by more generous non-federal law. Given these difficulties, we report only a few results of other surveys, all federal, "for what they are worth." The Orrick SDNY study found "[a]verage [d]amages" of $405,596 and, more meaningfully, $80,000 "[m]edian [d]amages." [43] Another study, employing Administrative Office statistics for 1999-2000, recounts "[m]ean [d]amages" and "[m]edian [d]amages" of $336,291 and $150,500, respectively. [44] Updated from 2000 to 2005 dollars, these equate to $394,223 and $178,429. [45] A third survey, also based on data from the Administrative Office, reports "[e]stimated median awards" of $150,000 for cases concluded by trial in 2006 [46] and $158,460 for cases concluded in 2000-2006. [47] To the extent that these numbers comprise more than just emotional damages, one would expect them to be higher than our pain and suffering medians — $50,000 in the SDNY, $63,750-$80,000 in the EDNY and $60,000 combined — as, indeed, they are. (The $80,000 median amount in the Orrick Study would almost surely have risen, moreover, if converted to dollars from a later period.) More than that one cannot really say. But the Orrick Study does offer one set of comparable monetary figures, for attorneys' fees and costs, for which the average and median awards were $226,194 and $43,121, respectively. [48] Recall that our averages in this category came to $267,659 (combined districts) and $396,367 (SDNY); the medians were $165,000(combined districts) and $79,625-$141,308 (average $110,466) (SDNY). Even accounting for inflation, the amounts we recorded seem to be substantially greater. Sampling error may well account for this discrepancy. [49] c. Adjudication Time According to the Orrick Study, the average time from filing to verdict in the SDNY was 30 months, while the median time was 28 months. [50] Our SDNY average and median came, respectively, to 30.8 and 29 months. The increase was, therefore, marginal. V. Conclusion: Our Results In ContextBoth theory and practical experience counsel that the suits that survive to verdict do not represent disputes in general. The seminal Priest-Klein hypothesis predicts that the extreme cases — ones that plainly favor the plaintiff or the defense — will tend to be resolved by settlement. [51] (Of course, weak claims are also vulnerable to dismissal.) Otherwise stated, triable cases are more likely to be tried. Our survey's results should thus have greater value as guidance the closer a lawsuit gets to trial. The model also posits that the weeding out of cases at either end of the spectrum will lead to an approximately even split in verdicts for plaintiffs and defendants. [52] Granted, our finding of a roughly one-third success rate for single plaintiffs does not bear out the 50-50 outcome prediction. Yet that conclusion applies only to parties who have equal stakes in the dispute and "equivalent information, experience, and skill." [53] Stake asymmetry correlates with whether parties are repeat players in litigation. [54] Because of concerns such as precedent and reputation, which transcend the immediate action, habitual litigants have greater stakes than "one-shotters" [55]; they also have a better chance of victory. [56] As compared with the average plaintiff, the mainly institutional defendants in employment discrimination cases are typically seasoned, high-stakes repeaters. [57] Thus, it comports with theory as well as common sense that they win, and plaintiffs lose, more than half the time. Furthermore, as we saw earlier, other research corroborates this study's ballpark finding. In closing, we stress that our claims for our work are fairly modest. Statistics can do no more than provide a useful background, not substitute, for detailed analysis of one's own case. Experienced practitioners should have a fairly good idea of witnesses' likely appeal to a jury, the range of potential damages awards, the proclivities of the presiding judge, and all of the other tangible and intangible factors affecting the decision when to settle and on what terms. We hope that our findings will usefully contribute to the overall efforts of attorneys and neutrals to provide a reality check to their clients confronted with the daunting prospect of trial.
ENDNOTES We thank Michael O. Finkelstein for having read this article in draft and provided many useful suggestions.
|